Some Background
I'll never forget how Cassie Beck and Frightmare asked me to coach Bay Area Derby's travel team. I was really surprised but it was also just so welcoming and cute.
A few things became quickly apparent to me. We had a lot of synergy, all of us wanted to make BAD a more inclusive experience ready to tackle new strategies. I also realized I had to really put my head down and figure out what I could contribute. I had not coached at all and needed to earn my place. So I listened and worked, but also I geeked out a bit.
TI-14: A BAD Rankings Calculator
One of the first things I did was create my own real-time WFTDA rankings calculator. This has been done many times before, and I quickly found the key issue with doing this on your own: the real accurate strength factors are rounded off in all the visible parts of the application and publications. But those numbers exist, the Rankings Calculator uses them and it also shares them in a consumable JSON format under the graphs and tables.
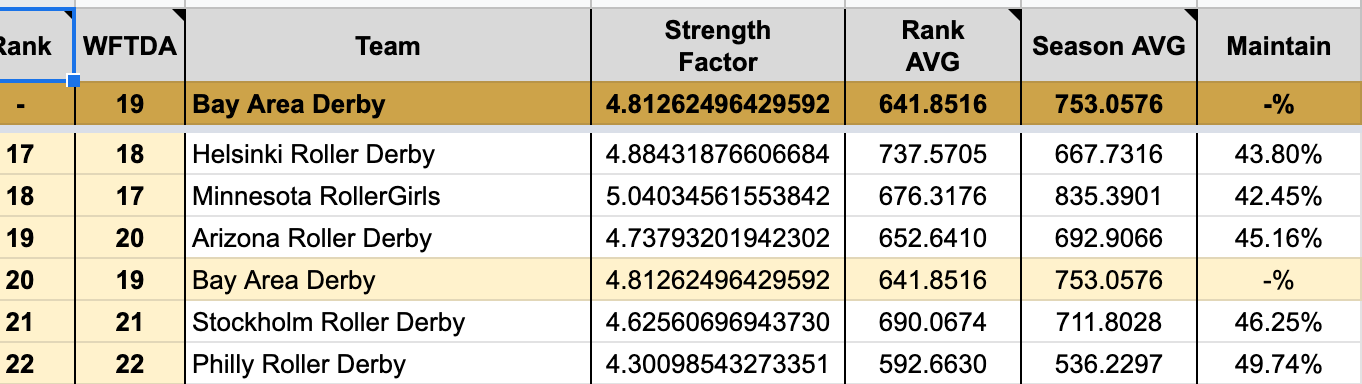
So I added a script to my Google spreadsheet that logged into the calculator and given a team ID number would grab all 14 significant digits for each month in a ranking interval and save them. With that critical piece, I had my own rankings calculator that was able to accurately predict results as I added new scores and it was even enough to bring into realtime game results. Frightmare even made it that much cooler by allowing me to supe up her bracket maker and single game calculator. I knew that we would need more though, something to crunch the numbers in-game as well.
In-Game Stats
With TI-14 (cute name that Cassie loves to taunt me about) in hand, I set out to make a bench stats tool. Luckily for me Rainy City generously released an awesome live stats tool and suggested other use and build on it. Over the course of BAD's season I used and improved the spreadsheet to extract useful data that helped craft adaptable strategies in game. BAD had a lot of catching up to do when it came to various derby strategies and once the word was out that BAD was #EmbracingChange other teams would adjust quickly. The season was a gradual evolution of new strategy and stats based insight.
As we gathered more data, we were able to hone in on what worked and didn't work more quickly. It took a lot to trust the data at first, but by the time we got to Playoffs we were using the live bench tool to help formulate jammer and pack matchups, adjust jammer attacks, sort out opponent weaknesses, and really accept an adaptable game. It was hard. It was fun. It was special.
I hope sharing this will help your team gain the confidence to try new things, strengthen pivot/jammer pairings, encourage your packs to try new start formations, and open up the lines for your jammers.
Bench Stats Tool
It took a while to figure out the best ways to use and interpret the original Rainy City stats and incorporate changes. Now that I have a season of use with it, I find it is great for backing up your gut hunches on jammers and giving hints at how to optimize lead jammer percentage. With that said, I'd like to share my changes now, with the hopes that there will be more improvements.
Changes from Rainy City's Bench Stats:
- Connect game stats to TI-14. (not available in public version)
- Add a Scoreboard Cheatsheet based on rankings targets.
- Extend the number of jammers and packs tracked.
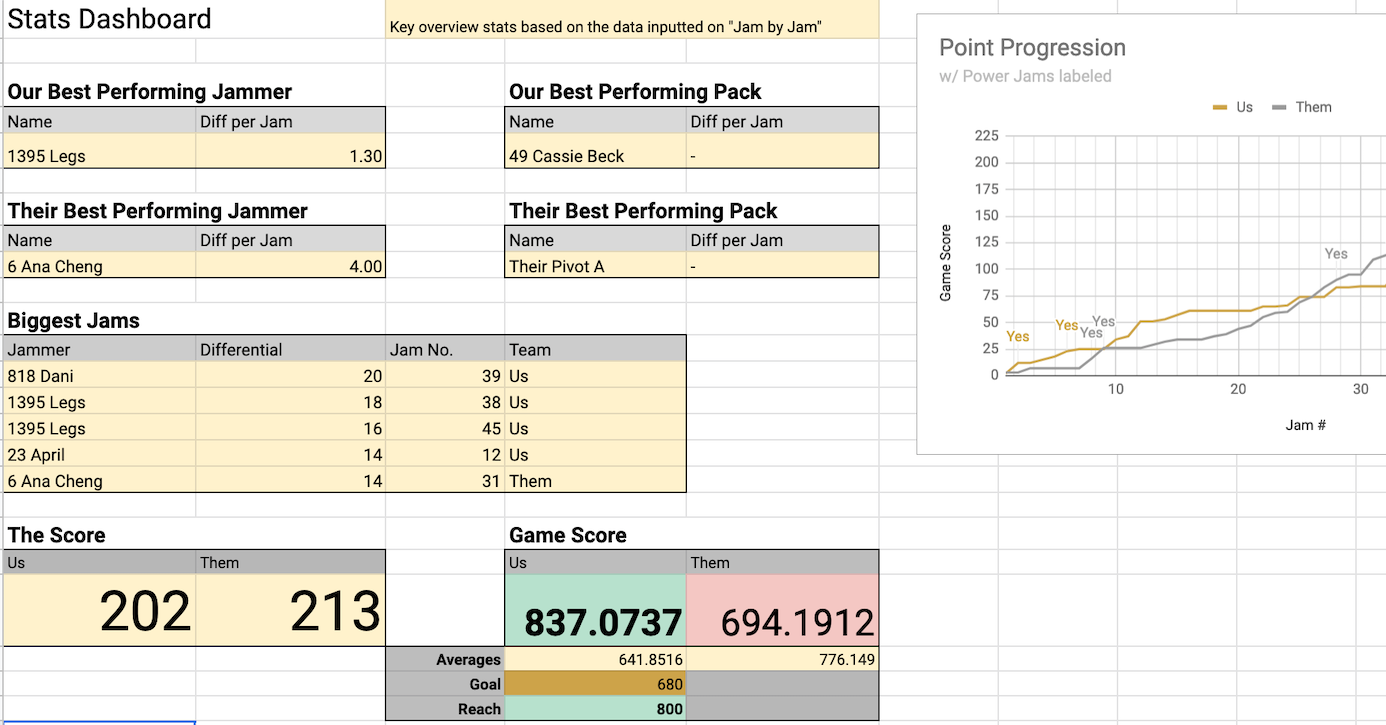
- Update Dashboard to remove stats that span 3 or fewer jams.
- Add a points spread graph to Dashboard.
- Add live WFTDA rankings game score and targets to Dashboard.
- Combine tabs together for quicker switching in-game.
- Add Power Jam tracking and Point per Power Jam and Penalty Kill.
- Add Lead % for packs and average lead time.
- Add start formation tracking and jammer point differentials for starts.
Link: A BAD Bench Stats Template
Unfortunately, I can't share TI-14 publicly as using it requires access to the Rankings Calculator. Never fear though, WFTDA has something awesome in store for derby stats geeks coming soon.